Week 8 (July 4 - July 8, 2022)
This week I experimented with reimplementing my distinct regions algorithm to use Euclidean color distance to measure color similarity of regions. The code is also reimplemented to compute mean region color from scratch, since we discovered in past weeks that the pymeanshift output floodfilled region colors can be a bit off. Unfortunately, the algorithm still performs poorly on black-and-white images. For example, below you can see that the black-and-white image requires a much stricter color similarity threshold for the algorithm to count the same number of distinct regions as it would for the RGB version of the image. In other words, it’s much easier for regions in black-and-white images to be counted as nondistinct. This is probably due to the fact that black-and-white pixel values can only range from 0-255 in a single channel (duplicated into 3 channels before counting distinct regions), whereas RGB images have three channels with independent values for each channel. Therefore, there’s much more room for color variation in a color image. For a black-and-white image like the zebra below, regions in the tree foliage and grass, for example, are much more easily considered to be similar size and color than in the RGB version.
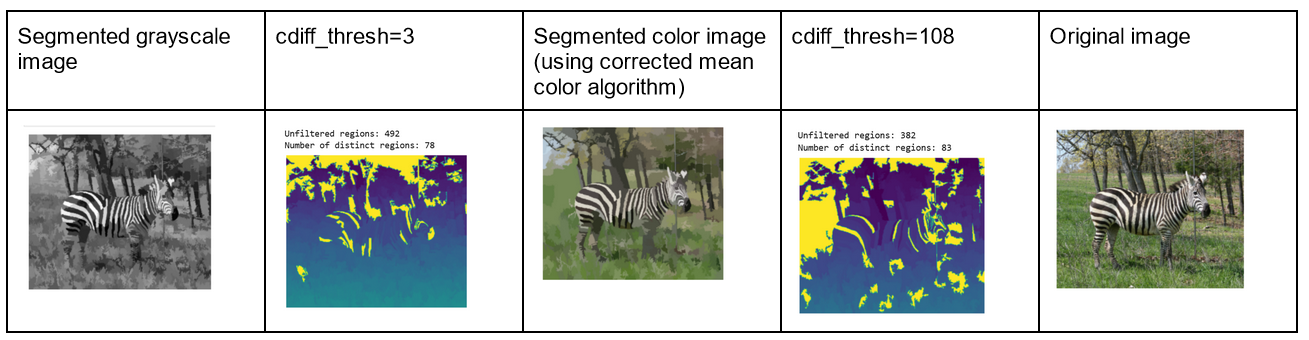
Professor Ordóñez-Román explained that this means my algorithm will likely also perform less well on images with low saturation. However, such images are usually the result of adding special effects, so the algorithm should still work well on non-manipulated color photos. The best we can do is filter out grayscale images from the data for now.
I also made the following changes to the dataset this week:
- Removed grayscale image filtering by captions. The only objective way to filter out grayscale images is to check if the image has 1 or 3 channels. This means that some grayscale images will be left in the dataset, since some have 3 channels.
- Resplit data to get train/val/test splits. To prevent people from cheating on image captioning and object detection tasks on the testing data, the COCO dataset annotations are not public for the test split. However, we need a test split to evaluate the trained complexity prediction models on that is independent of the train/val splits. (Since the val split is used to select the model with the highest accuracy during training, of course we cannot use the validation set as an unbiased measure of how a model would perform in general! And models overfit on the training data.) The solution is to take some of the COCO training data and use it as a validation set, then use the COCO validation data as a test set.
- Using ALL the image captions during training. Before, I had been taking only 1 caption per image, and discarding the other 4. But this wastes data! Instead, each caption should be used during training with the complexity score for the associated image. This results in 5x the data since most images have ~5 captions.
For qualitative analysis of the model predictions, I wrote a script to build html pages of models’ complex/noncomplex predictions, including side-by-side comparison of scores on different captions for the same image.
Next week, I will be presenting my project to Veronica and Ziyan. Besides putting together the presentation, I need to train complexity classifiers on my new data split. Also, I still have the training of the regression model to get to. And recomputing the complexity data with my reimplemented distinct regions algorithm.
Other fun things this week: Veronica and I visited Houston’s Museum of Fine Arts and we had a lab lunch. Rice campus is conveniently located right next to Houston’s museum district.
Image: Photo of Monet’s Water Lilies (1907), Museum of Fine Arts, Houston, Texas. 3 July 2022. Personal photograph by author.