Week 6 (June 20 - June 24, 2022)
This week, I trained BERT to classify images as complex v. noncomplex from their captions.
Using the algorithm I developed last week to count mean-shift segmented # of distinct regions per image, I calculated complexity scores for all ~123,000 COCO Dataset images. I then took the top and bottom 10% of images with the most and fewest mean-shift segmented distinct regions in the train and val sets, and labeled these as “complex” and “noncomplex” for BERT training.
I then wrote Python scripts to implement PyTorch Dataset and DataLoader classes for loading image captions, metadata, and labels into the model. After training the model, I found that it was able to predict the complexity label of an image from just its caption with ~80% accuracy on the validation set. However, I noticed some concerning patterns among the images it tends to predict are complex v. noncomplex (see below for examples):
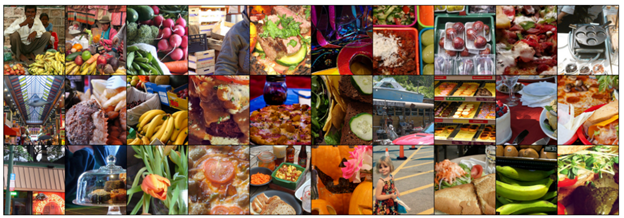
Captions for some of the above images:
- ‘A man and young girl surrounded by various fruits.’
- ‘some people at an outdoor shop and some different fruits’
- ‘An assortment of fruits and vegetable all set together’
- ‘A woman selling raw carrots at an outdoor market’
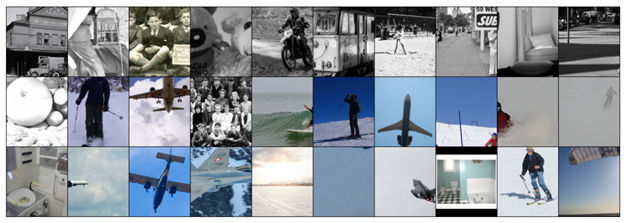
Captions for some of the above images:
- ‘A black and white photo shows someone standing on a beach behind a curtain’
- ‘a black and white photo of children siting posing for a photo’
- ‘A black and white photograph of a stuffed teddy bear wearing a shirt that reads “handle with care” and a small stuffed sheep.’
- ‘a black and white photo of a person riding a dirt bike’
- ‘a black and white photo of a train ‘)
Many of the predicted complex images contain food, and many of the predicted noncomplex images are black and white. What if the model is exploiting references to food or phrases like “black and white photo” to classify images as complex/noncomplex? After all, food images do tend to have more mean-shift segmented regions, whereas black-and-white images tend to have fewer. But ideally, we would like the model to focus instead on things like the number of objects described in the caption, not whether or not it contains food, as an indicator of complexity!
To address these confounding factors, Professor Ordóñez-Román suggested I try training and testing the model on images from each COCO object category, i.e., how well is the model able to classify as complex/noncomplex images containing food only? This way, the model is less able to exploit the presence/non-presence of certain types of objects (e.g., food) in its predictions. I ran this experiment for color images (i.e., filtering out images described as black and white in their captions), and the good news is that the model is still able to classify images correctly even without hints about whether the image is black and white, which means it must be picking up some information about noncomplex images besides the fact that many of them are black and white. I still need to run this experiment for the different object categories, however.
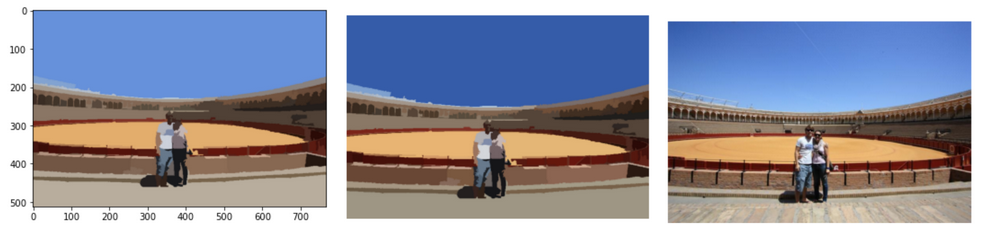
Revisiting my algorithm for counting distinct number of regions, which relies on the Python pymeanshift module, Professor Ordóñez-Román noticed something strange about the color fills output in the segmentations. This is important because one of the criteria for counting distinct regions is comparing the colors of regions, and I had been sampling region color from the pymeanshift output. I tried calculating the mean color of each segmented region using the original pixel values from the images, and indeed the colors of the segmented images are not the same as the arithmetic mean of the pixel values from the original image. This might introduce some artifacts into my complexity metric. If computing mean region color isn’t too expensive (must revisit this to confirm), recalculating the complexity data for COCO is something I may do.
You can see that when I compute mean region color from scratch (below left),
the colors are truer to the original image (below right) than the pymeanshift
output (below center).
I also will look into the robustness of my algorithm on RGB v. grayscale images. A simple test is to compare # of distinct regions for an RGB image with # of distinct regions for its grayscale version.
Another issue I discussed with Professor Ordóñez-Román this week is choosing the correct loss function and number of outputs for my model. I had been outputing two outputs for each sample and converting these to P(complex) and P(noncomplex), which is really redundant since this is a single-label binary classification task, so P(complex) = 1 - P(noncomplex). The model should really only be outputting a single score. Then, during training, I should convert this to P(complex) via the sigmoid function to determine the label for the sample. Therefore, I will need to refactor my code to take this into account.
Professor Ordóñez-Román also suggested that the next steps after running these classification experiments would be training a regression model to predict # of distinct regions per image.
Other things going on this week:
- Flying to Rice on Tuesday
- Meeting Professor Ordóñez-Román and Ziyan (the PhD student I am working with) on Wednesday (and possibly Veronica, another DREU student)